Hello, my name is Jonathan Choi

Full Stack Web Developer


Developer Support Engineer

ScientiaMobile

GWU Coding Certificate Awarded: March 13th, 2020

A little about me

Born and raised in Virginia, I am a graduate of George Mason University with a Bachelor's of Science in Public Health. I have worked in a variety of fields, from butcher's assistant to specimen management technician, and I am now pursuing a career in web development. I have always had a passion for building models as a child and as an adult, web development has been a perfect fit for my tendencies of fiddling and fitting various pieces together. After hearing about the GWU Bootcamp from a coworker, I decided to take the leap of faith. I am really enjoying the program and really proud the progress that I have been making having had no prior experience with web development.


The correlations between web development and my hobbies has been eye opening. I have always had an interest in computers, but my interest had been surface level in terms of hardware,web-surfing, and computer games. My father has always been technologically savvy and wished to impart onto me the knowledge of building a computer. I built my current desktop as a freshman in college and have been upgrading it incrementally throughout the years. As a child I have always enjoyed fiddling with Legos, plastic model kits, and sculpting. Web design take these interests of mine and gives me the freedom to create from start to finish in a way that I find very engaging and satisfying. As a fledgling web developer, I hope to gain all the experience and absorb all the information within the GWU Bootcamp and becoming both competent and proactive in learning and developing.


I have recently completed the GWU Coding BootCamp on March 13th, 2020. I am currently seeking a new opportunity in Web Development and would be honored if you looked through my portfolio. Though I may be lacking in experience, I will make up the difference by putting in as much effort as humanly possible. Passion is what I feel when it comes to web-design which has been wavering within my past endeavors. I would very much appreciate any and all feedback. Thank you for visiting my web page and please feel free to send me a message below.


Featured Map:


African Sister Cities Map

Published Article

The African Sister Cities Map was created using Carto and the basemap created in MapBox. The map illustrates how the Africa enriches American's Daily lives by highlighting the economic, political, social, and cultural ties to the 15 featured U.S. Cities. When you click on a city's marker, a custom side panel comes from the left to help illustrate the ties between said city and the African influences it holds as well as pertinent information. Several cities also contain links to other publications going into further detail on the connection and influence between the city and African sister city.

Regional Products Map

Published Article

This map utilizes the HighMaps library to create a data visualization on the gross regional product of China's most global cities. As you hover over each bubble, you will be able to view how much each city generates in U.S. dollars. For better ease of use, a button to zoom both in and out have been added as well as the ability to click and drag your viewpoint on the map.

Disposable Income Map

Published Article

This map utilizes the HighMaps library to create a data visualization on the disposable income of per capita of various cities/provinces. Each city/province is color coordinated in scale with the amount of disposable income. As you hover over each section, you will be able to view how much each disposable income they have in U.S. dollars as well as having the key change at the bottom with the colors.

Global Nutritional Funding Split Bubble Chart

Published Article

This data visualization utilizes the HighCharts library to create a split packed bubble chart on the allocation of Global Nutrition Funding in 2017. As you hover over each bubble, you will be able to view where the funding was distributed in U.S. dollars in each of the continent bubbles. North America is not located within the data visualization as no ODA was allocated in 2017.

China's Global 500 TreeMap

Published Article

This map utilizes the HighMaps library to create a data visualization on the total number of fortune global 500 companies located within each headquarter city. Each block is color coordinated in scale with the amount of companies in the city. As you hover over each block, you will be able to view how many companies are located within each city.

Dibao Mixed Chart

Published Article

This data visualization was created using the HighCharts library to create a chart which combines the concepts of a multi bar chart as well as a line chart. The data visualization categorizes the dibao coverage in the fourth quarter each year. When you hover over the chart, you will see a shared tooltip with the number of people covered in both urban and rural areas of China as well as the share of the total population and each year.

GNI Multi Line Chart

Published Article

This data visualization was created using the HighCharts library to create a multi line chart. The data visualization categorizes various countries and their GNI per capita in BRICS economies. When you hover over the lines, you will see a shared tooltip with the GNI per Capita of each country as well as the year in which the data represents.

China Missile Launchers by Type

Published Article

This data visualization utilizes the HighCharts library to create a stacked bar chart. The data visualization categorizes various missile launchers by type and the share of total launchers in percentile. When you hover over the bars you will see the percentages of what type of launchers in China throughout recent years.

Mobile Payment Data Visualization

Published Article

This is the first data visualization I have made using the HighCharts library. It takes a look at the trend of mobile payments in China and divides them into quarters for seven years, demonstrating how the value has changed. As you hover over the various columns, you will see the value of mobile payments converted to trillions of U.S. dollars as well as the year and quarter.


Featured project:


WorkHQ

Heroku / GitHub

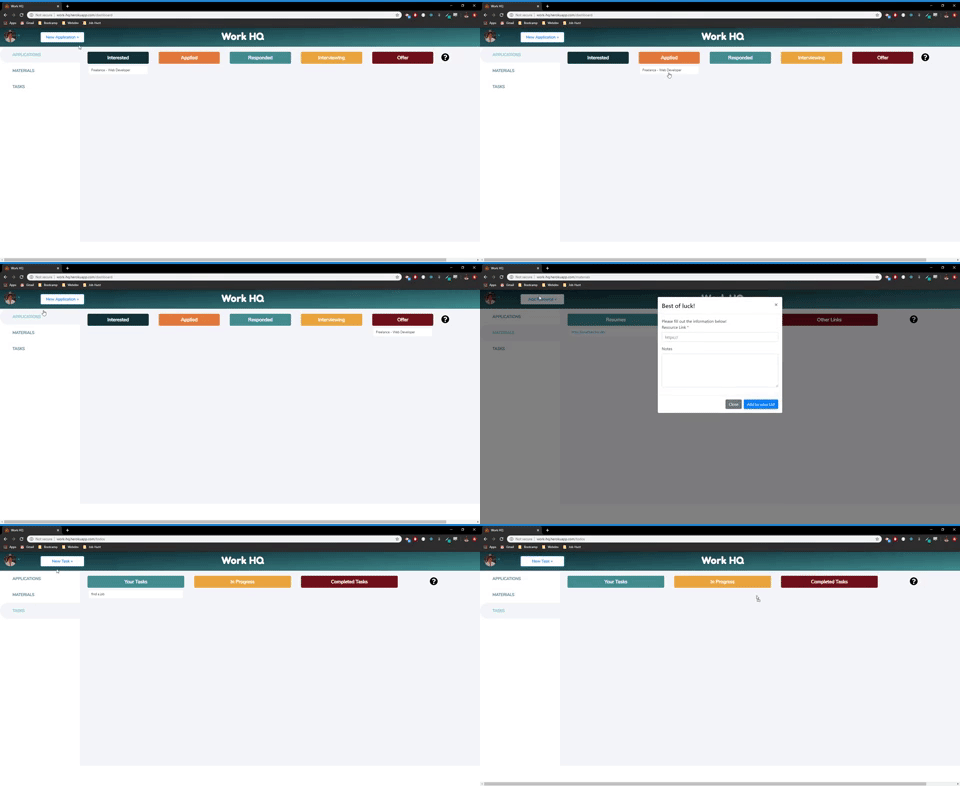
WorkHQ makes it easy to find jobs you're interested in, apply to them, and add them to a tracker that organizes your entire search making the process a little more manageable. Users are able to import jobs from any source, including major job boards, keep track of their active applications, and store their job search materials including resumes and cover letters. Many job-seekers keep track of their job applications across different tools including excel and kanban style lists, but WorkHQ makes it easy to keep everything organized in one place.

WorkHQ is a collaborative project developed by myself, Sam Randels, and May Hitchings.

Palssport

Heroku / GitHub

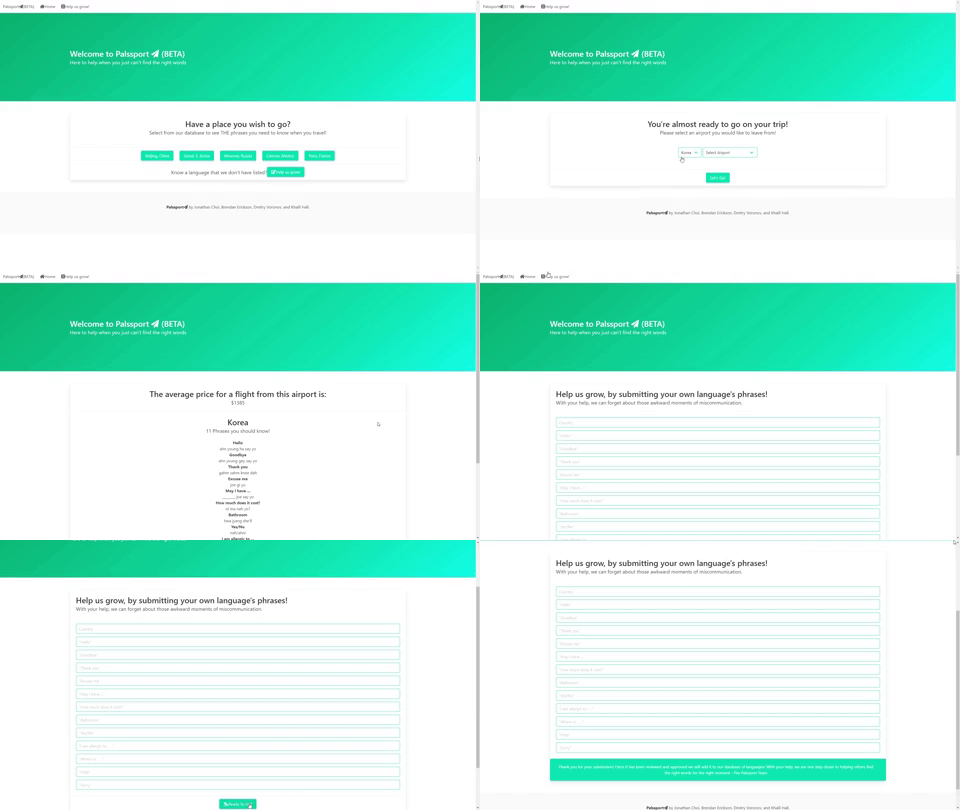
Palssport is intended for the casual traveler or the international business person. Our application gives its users ticket prices and a dozen useful phrases for a specified location. Users are also able to submit potential new translations for other languages into our database. However, these submitted phrases are not available immediately as they must be approved by our team to hold a high level of accountability and quality.

Palssport is a collaborative project developed by myself, Brendan Erickson, Dmitry Voronov, and Khalil Hall.

StarXed

GitHub Pages / GitHub

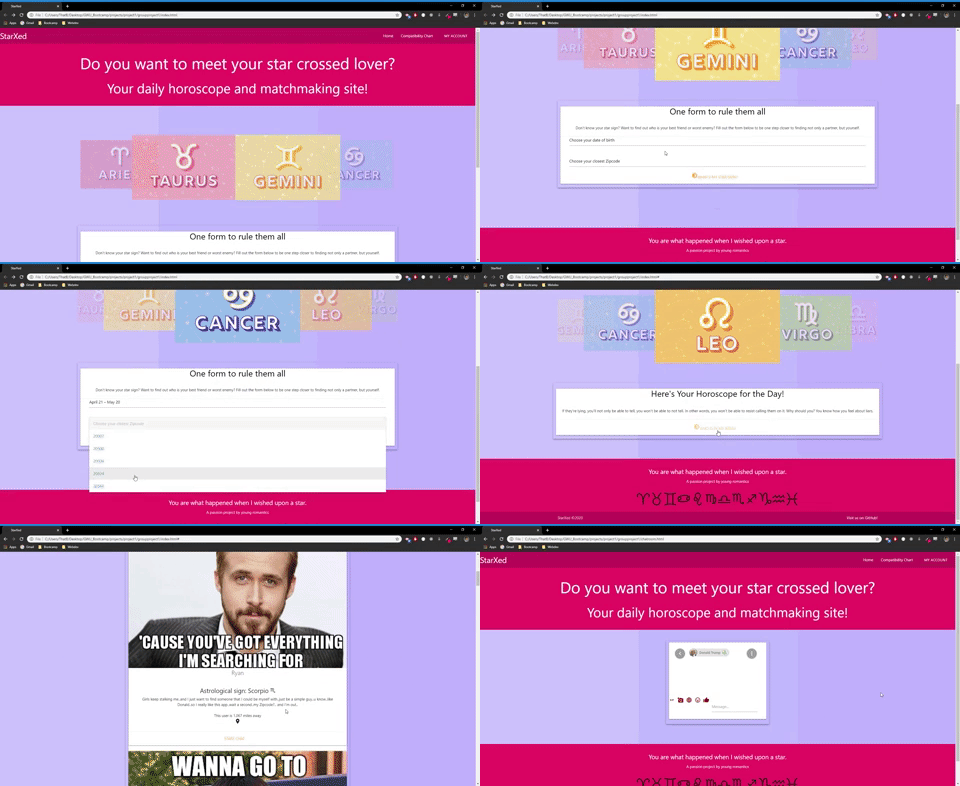
StarXed is a web application developed by myself and three others that offers users a unique experience. Part daily horoscope and part matchmaking service, StarXed matches users based on compatible star signs with picture profiles, distance, and chat functionality. It is build using Materialize CSS, jQuery, MapQuest API, and Aztro Horoscope API.

StarXed is a collaborative project developed by myself, Brendan Erickson, Katie Durga, and Anna Panas.

LA Mart

Live Site / GitHub

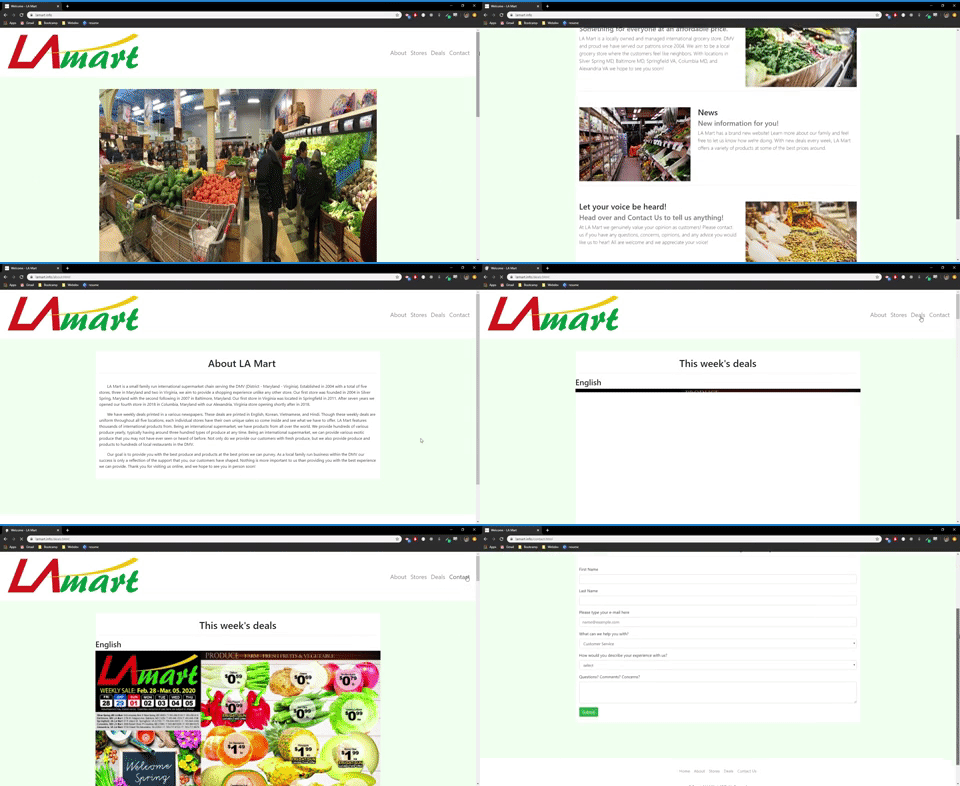
Freelance project commissioned by LA Mart. LA Mart is an international supermarket serving the DMV (District-Maryland-Virginia). The website is built utilizing Bootstrap CSS with a little javaScript. Formspree was used for the contact form allowing for the filtering of potential spam submissions and redirection to company's email address. Images are provided by LA Mart Inc. and Unsplash.

JChoi Wedding

GitHub Pages / GitHub

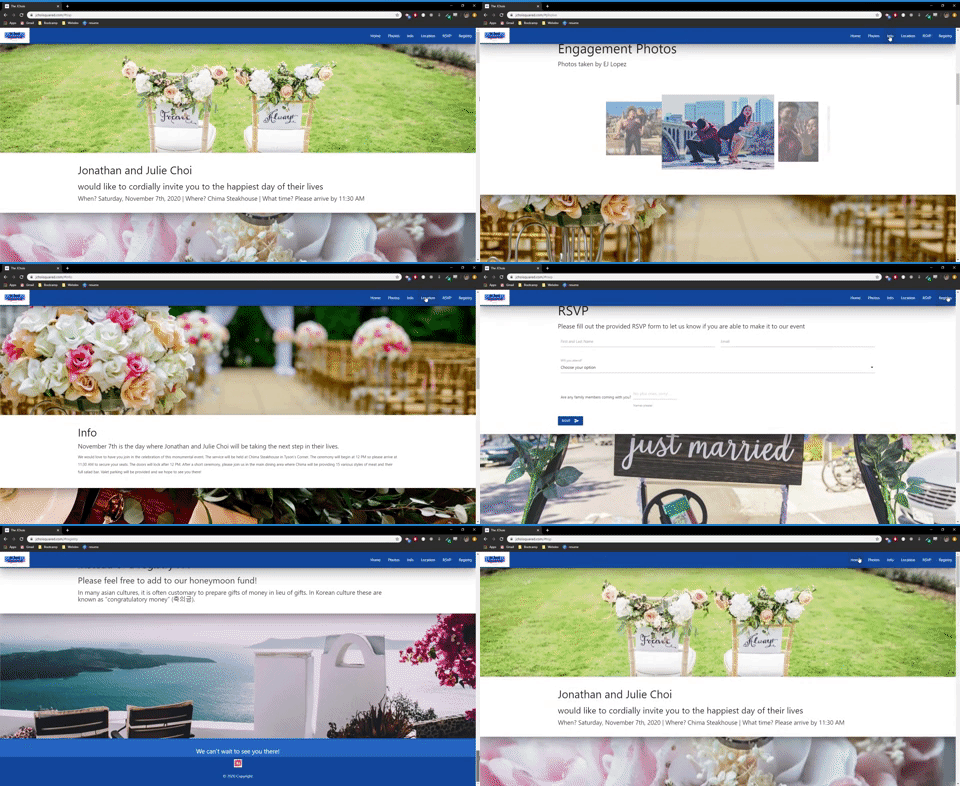
This website was created for my wedding later this year. It's main purpose is to inform guests with information regarding the wedding. The site also features a form submission for RSVPs. If you have not received a paper invitation, please do not fill out the online RSVP form. It was created using Materialize CSS as well as a little jQuery. Stock photos were provided by Unsplash. Logo created with Canva.

Employee-Search

Heroku / GitHub

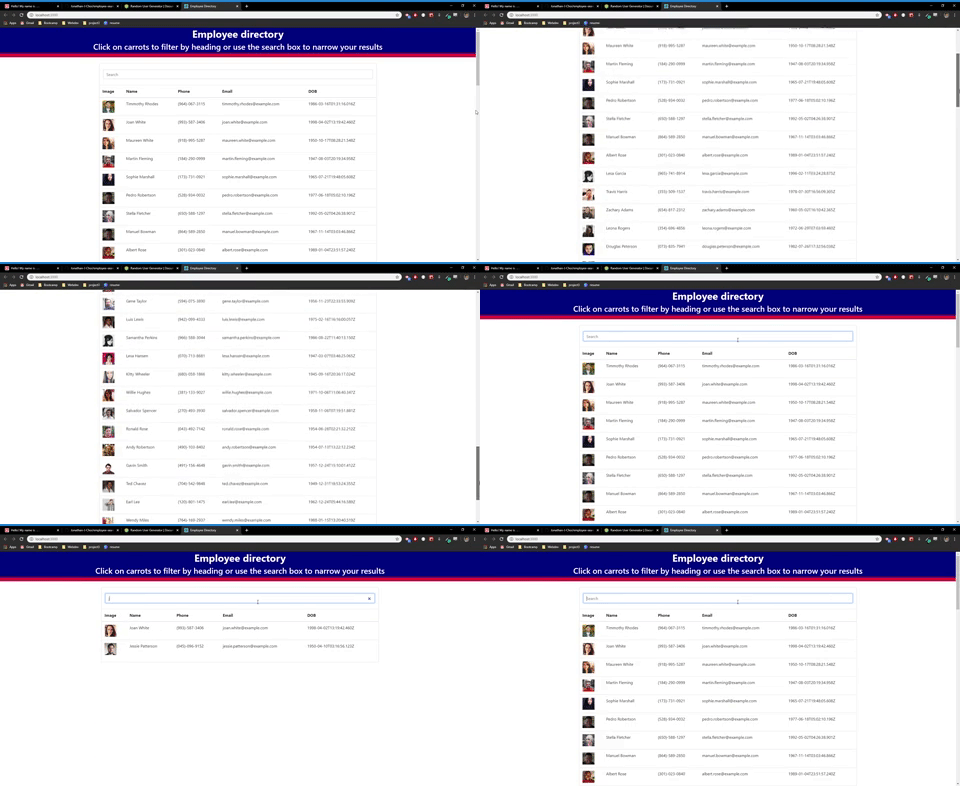
This react application displays fifty employees generated by the RandomUser.Me API. Filter through the employees by typing into the search bar. The information displayed of all employees include a photo, name, phone number, email, and date of birth. This application is built using React.js, Bootstrap, and the RandomUser.Me API. It is hosted on Heroku.

Liri

GitHub

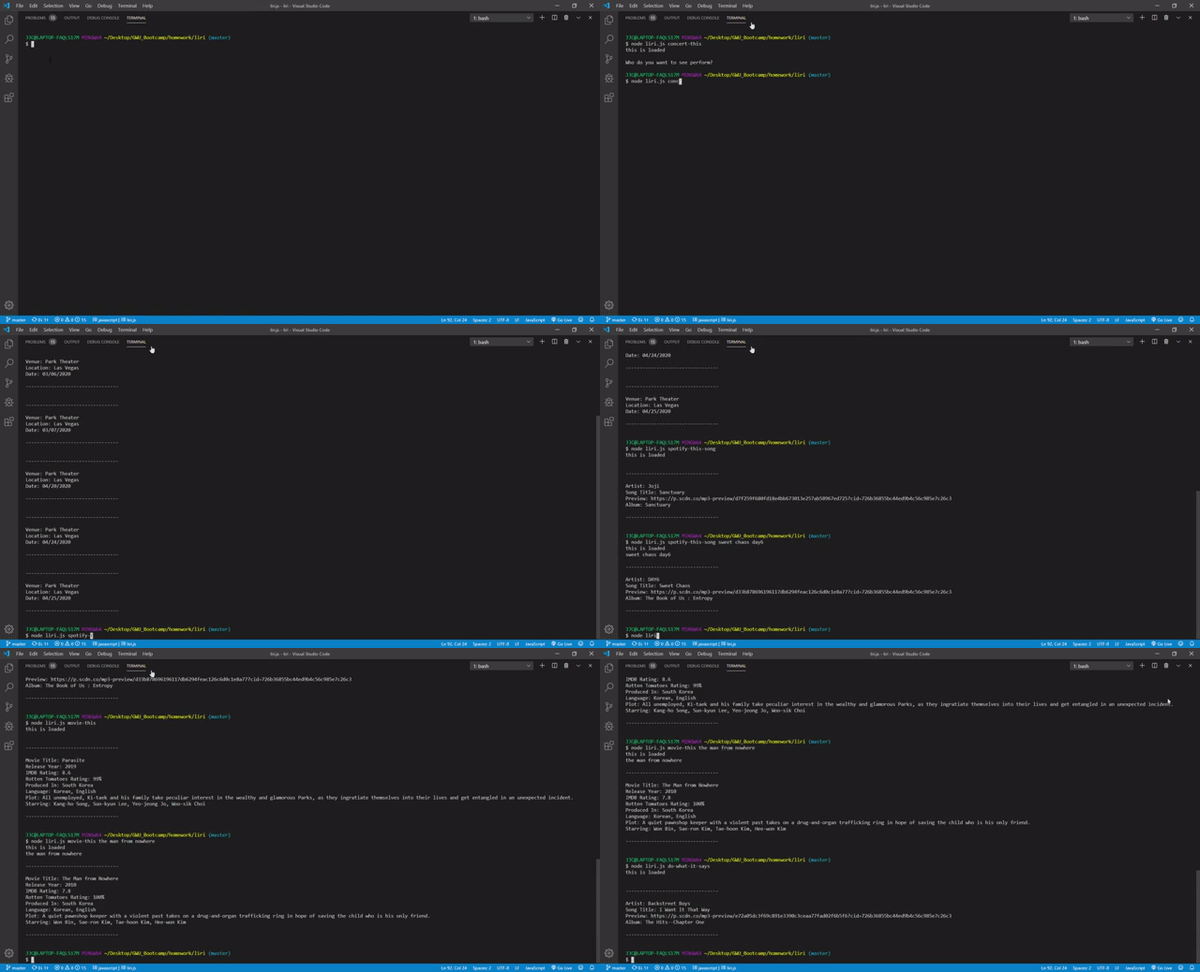
Liri is a node based application which takes user input and display information about movies, concerts, and song information via Spotify API. By utilizing BandsInTown API, Liri is able to take your query of artist and display tour dates and locations. Likewise with the OMDB API with movie information

Employee-Summary

GitHub

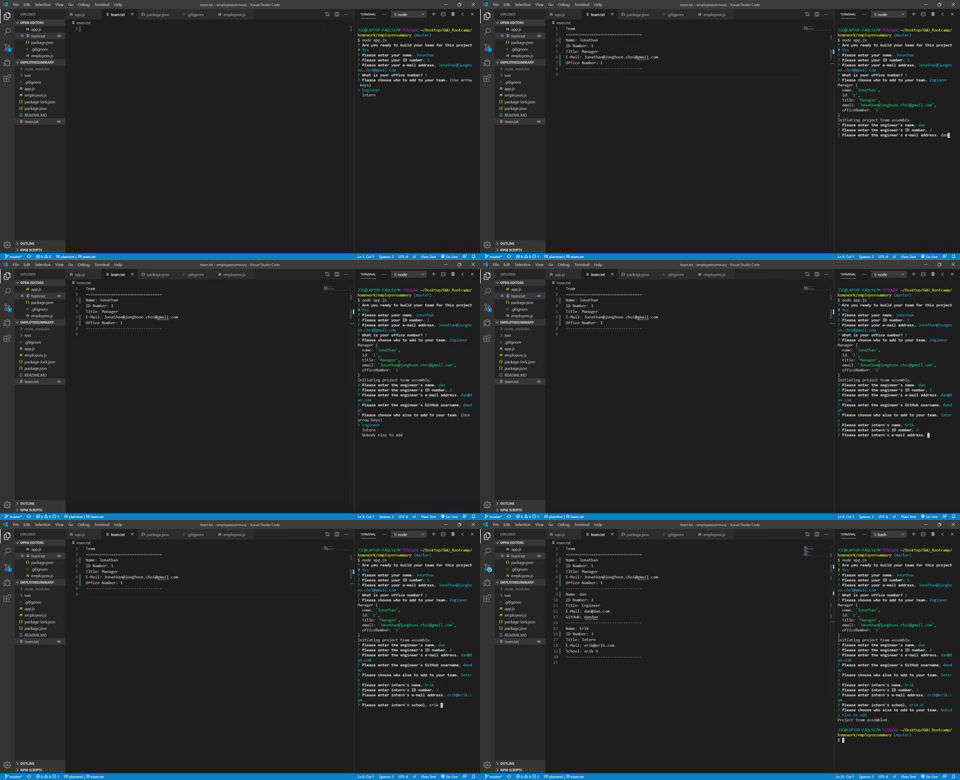
Employee-Summary is a node based application which prompts user input via Inquirer. By taking user input, Employee-Summary is able to build a text file with the corresponding information for a Manager to build their project team. Team members that can be added include engineers and interns. Each employee type has individualized inputs relevant to their position.

Circadia

GitHub Pages / GitHub

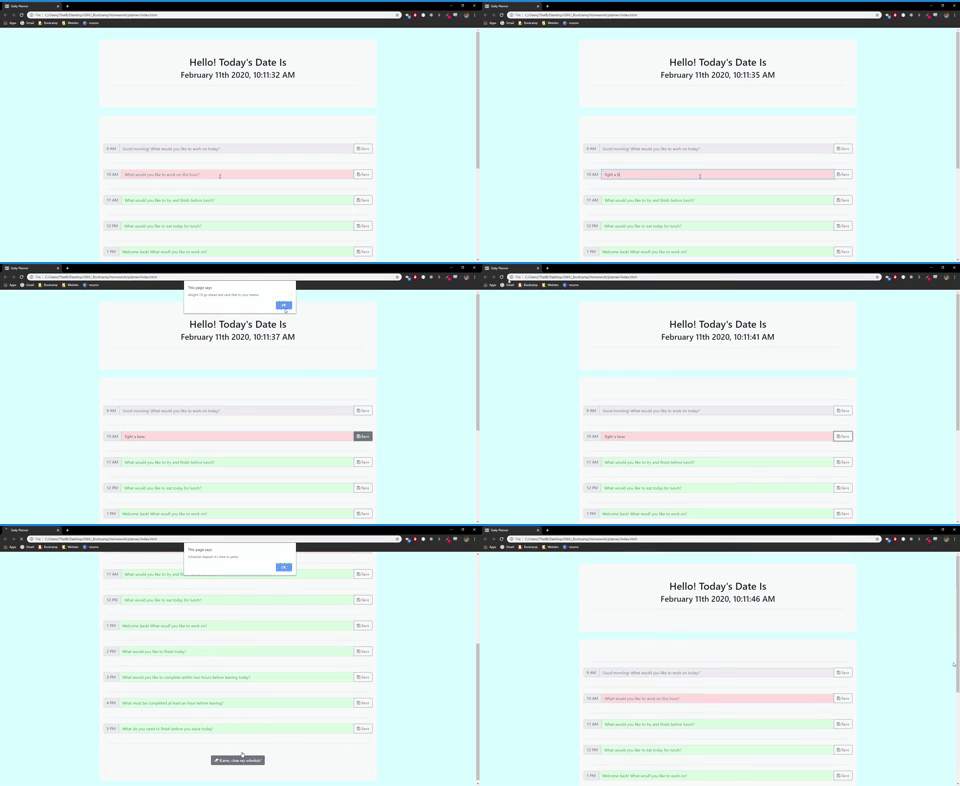
Circadia is one of my first web based application which uses Moment and local storage to provide the user with a personalized daily planner. Moment is used to provide a realtime clock which changes colors of events in the past [grey], current [red], and future [green]. Users are able to view their daily schedule and save notes to the corresponding hour. At the end of the day users are able to clear their schedule with the click of a button.

First Reactive Portfolio

GitHub Pages / GitHub

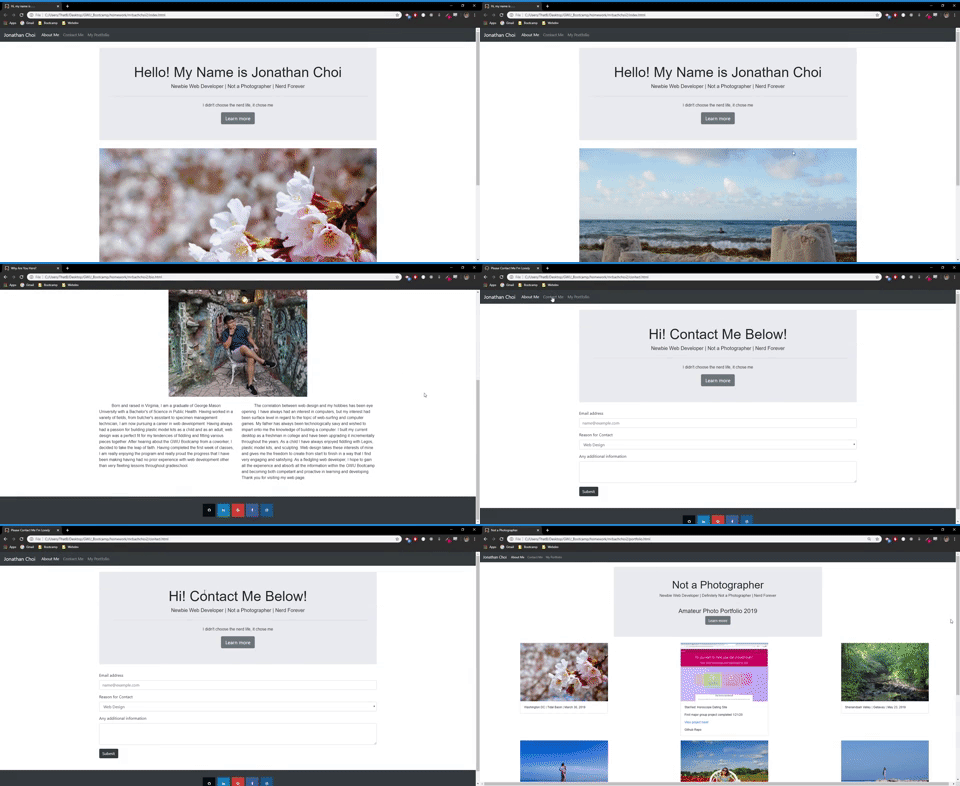
This web page is built using BootStrap and is my first reactive web page. It features a rotating carousel of photos that I have taken as well as separate pages for a bio, contact, and portfolio. As this project was made at the beginning of my web development career there is only a single project on the portfolio page.

My First Web Page

GitHub Pages / GitHub

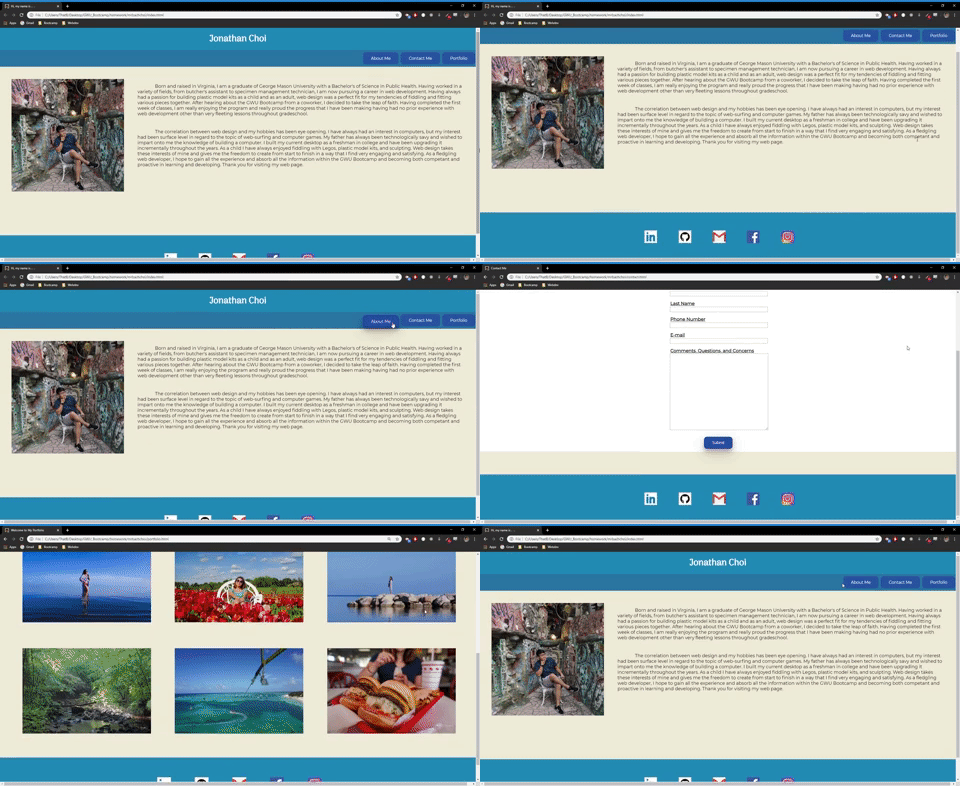
This is the first web page that I have made. It uses basic HTML and CSS. A contact me page and portfolio are also coded. The portfolio only holds photos that I have taken instead of any projects.


Contact me